Real wages
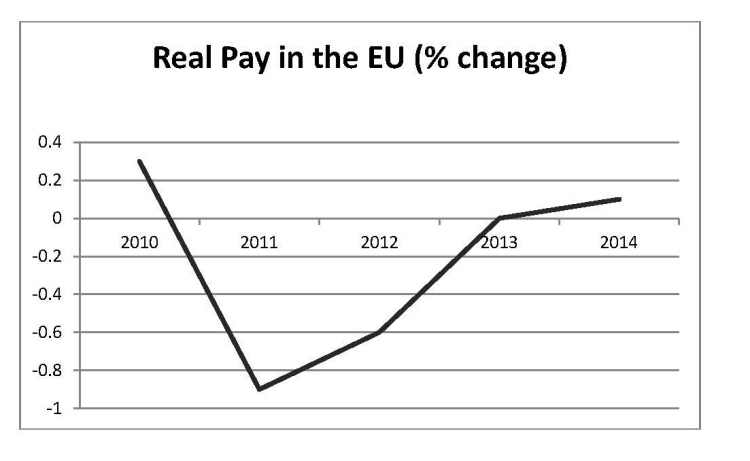
Wages growth slowed in the first quarter of 2014 to 0.9% in the euro area and 1.2% in EU of 28 states, according to Eurostat. Inflation in the first quarter stood at 0.7-0.8% in the Eurozone therefore wages barely rose in real terms, after purchasing power stagnated in 2013 and fell in 2012 and 2011.
Breakdown by country
(% change from the previous year *)
| 2008 | 2009 | 2010 | 2011 | 2012 | 2013 | 2014** | |
| Belgium | -0.9 | 1.2 | -0.9 | -0.3 | 1.1 | 1 | -0.3 |
| Bulgaria | 4.8 | 5.6 | 6.9 | 3.4 | 0.5 | 3.1 | 2.1 |
| Czech Republic | -2.1 | -1.2 | 1.9 | 0.2 | -1.2 | -2.3 | 1.2 |
| Denmark | -0.1 | 2.2 | 1.3 | -1.4 | -0.9 | 0.9 | 0.2 |
| Germany | -0.7 | -0.1 | 1.2 | 0.5 | 0.5 | 0.3 | 1 |
| Estonia | -0.9 | -3.3 | -0.4 | -4.6 | 1.8 | 3.5 | 4.1 |
| Ireland | 2.1 | 0.6 | -2.2 | -1.3 | -1.1 | -0.8 | -1.5 |
| Greenland | -0.6 | 2.2 | -7.3 | -6.5 | -5.2 | -6.1 | -1.1 |
| Spain | 2.8 | 4.4 | -1.6 | -1.8 | -2.2 | -0.5 | -0.8 |
| France | -0.4 | 1.9 | 0.8 | 0.2 | 0 | 0.4 | -0.1 |
| Croatia | 1.1 | -1.2 | 0.8 | 0.8 | -0.2 | -1.3 | -0.3 |
| Italy | 0.3 | 0.9 | 1.2 | -1.6 | -2.3 | 0 | -0.4 |
| Cyprus | -1 | 2.4 | 0 | -1 | -4 | -9.9 | -5.8 |
| Latvia | 0.4 | -16 | -5.5 | 11.9 | 4.6 | 4.3 | 2.9 |
| Lithuania | 3.2 | -14.1 | 6 | 2.2 | 0.6 | 3.1 | 1.9 |
| Luxembourg | -0.7 | 1.8 | -0.2 | -1.3 | -0.9 | -0.9 | 1.2 |
| Hungary | 1.2 | -5.7 | -5.2 | -0.3 | -4.9 | -2.2 | 2 |
| Malta | -0.5 | 1.4 | -0.5 | -1.9 | -1 | 1.1 | -0.1 |
| Netherlands | 1.1 | 1.5 | 0.6 | -0.9 | -0.9 | -2.7 | 0 |
| Austria | -0.1 | 2.1 | -0.5 | -1.2 | 0 | 0.2 | 0 |
| Poland | 4.7 | -0.5 | 2 | 0.7 | 0.4 | 1.7 | 1 |
| Portugal | 0.3 | 3.7 | 0.6 | -4.2 | -4.8 | 2.1 | -1.8 |
| Romania | 24 | -7.5 | -9.4 | -1.6 | 2.2 | 2.6 | 1.9 |
| Slovenia | 1.7 | 0.9 | 1.8 | -0.5 | -3.8 | -2.1 | -1.8 |
| Slovakia | 3.1 | 1.6 | 4.4 | -2.1 | -0.9 | 0.5 | 1.5 |
| Finland | 0.5 | 0.7 | 0.1 | -0.1 | 0.3 | 0.2 | -0.3 |
| Sweden | -1.8 | -0.3 | 1.2 | -0.6 | 2.2 | 2.2 | 1.6 |
| United Kingdom | -1.9 | 0.2 | -0.2 | -2.5 | -0.9 | -1.3 | -0.7 |
| EU | -0.4 | 0.8 | 0.3 | -0.9 | -0.6 | 0 | 0.1 |
* Nominal wages deflated by the Harmonised Index of Consumer Prices (HICP);
** Data for 2014: forecast by the European Commission (Autumn 2013)
Source: AMECO database of the European Commission
Thanks to European Trade Union Institute for supplying.
Nominal Wages Trend
Eurostat – wages Eurostat – inflation
—————————————————————————————————————————————
Related News
Unpaid: 1.1 Million Greek Workers (31.8.2013)
Portuguese wages plummet (14.8.2013)
Greek salaries cut by another 10% (3.7.2013)
Bank of Spain’s seeks suspension of minimum wage (31.5.2013)
Portugal’s government to cut public sector wages by 4% (20.5.2013)
The Euro area and internal wage devaluation (17.4.2013)
Southern Italian wages lower than Greece, NEETs rising (19.3.2013)
Multinationals blackmail Greece: Part-timers on €250-300 monthly salary (4.3.2013)
Next Up For A “Recovering” Europe: A 30-50% Collapse In Wages In Spain, Italy And… France (12.2.2013)
Hollande Backs French Labour Deal Allowing Cuts to Wages (14.1.2013)
Outrage as nurses appointed at less €4 an hour in Portugal (5.7.2012)
—————————————————————————————————————————————-
Wage cuts, freezes hitting public sector workers
| Pay Cut | Pay Freeze | Other measures | |
| Belgium | Proposed replacement of seniority advancements with bonuses. Employment in central government fell by 12% between 2009-2011. | ||
| Czech Republic | 10% cut in wages in 2011 | Until 2014 | |
| Denmark | No real wage increase in 2010 | Removal of seniority bonuses in 2011 | |
| Germany | 6.3% wage increase between 2012-2014 for 2m public sector employees | ||
| Estonia | Cut in basic payoff around 6% -larger reductions in public administration between 2008 and 2010. | 2009 and 2010 | Abolition or reduction of performance related supplements and other additional payments |
| Ireland | At least 5%, 10% for new recruits | ||
| Greece | A series of on-going pay reductions and a new pay structure | Pay freeze for public sector workers earning more than €2,000 per month (2009) | Reduction and subsequent elimination of 13th and 14th monthly salary-and new pay structure with a total effect of minimum least 15-20% pay reduction. Complete change of collective bargaining system and shift to elements of incentive pay. In 2011, increased working hours from 37.5 to 40 hours per week. Planned reductions in employment of 150,000 (20%) by 2015 |
| Spain | 5% pay cut in 2010 | 2011 and 2012 | In 2012 increase in working hours from 35 to 37.5 hours per week and increased contact hours for teachers |
| France | Pay scales frozen for 2 years | Replacement of 1 in 2 staff that leave the public sector | |
| Italy | 5% on salaries over EUR 90,000, 10% over EUR 150,000 for 2011-2013 | Wages frozen at 2010 level for 2011-2013 with possible extension to include 2014 | Collective bargaining suspended 2010-2012 Workforce attrition – only 1 in 5 workers replaced in 2011-2013 period with possible extension until the end of 2014 |
| Cyprus | Proposed in 2011 | 3 years | |
| Latvia | 15% in 2009; 2010 pay cut by 20% for higher paid & by 15% for lower paid | As part of package agreed with the IMF: introduction of single remuneration system for those in central & local government institutions, which cut pay in 2010 by on average 5% compared with 2009. | |
| Lithuania | Cut of 15% | Until 2012 | |
| Hungary | Cut by 7% in 2008-2010 | Pay freeze since 2009 | Abolition of 13th month salary (8% of annual salary) replaced by lower flat-rate payment for most public sector workers(2009/10) 7000 government job cuts announced in 2012 |
| Netherlands | No wage agreement concluded in central government since 2011-a wage freeze | Planned job reductions in central government by 2015 Ending of LIFO principle in 2012 making it easier to dismiss central government workers | |
| Poland | For two years | Teachers excluded from pay freeze (pay has increased) | |
| Portugal | 5% pay cut in 2011 For 2012 13th and 14th month payments suspended for medium and high salaries, despite a challenge in the Constitutional Court | 2 year pay freeze from 2011 until 2013 | Reductions in health benefits. |
| Romania | 25% temporary cut in 2010 partly restored under new pay system | 2012 | The new pay system introduced in 2012 eliminates a range of bonuses and abolishes the 13th month pay |
| Slovenia | 4% in 2011, additional cuts of 8% on average in 2012 | 2011 and 2012 (six months) | |
| Slovakia | Paybill cut by 10% in 2011 | Teachers and some other groups are not affected by the pay cut | |
| Sweden | No -wage moderation | Reductions in employment of staff on fixed-term contracts | |
| United Kingdom | Cuts in premium payments and allowances, especially in local government | 2010-2012 some exemptions for lower paid | Cap on pay rises of 1% planned for 2013/14 Large reductions in employment underway –in excess of 10% between 2010-2015. |
Source: Table 4.4 , Industrial Relations in Europe 2012, European Commission
Minimum Wages
In January 2012, 20 of the EU’s 27 member states (Belgium, Bulgaria, the Czech Republic, Estonia, Ireland, Greece, Spain, France, Latvia, Lithuania, Luxembourg, Hungary, Malta, the Netherlands, Poland, Portugal, Romania, Slovenia, Slovakia, and the United Kingdom), Croatia and Turkey had national legislation setting a minimum wage by statute or by national intersectoral agreement. Monthly minimum wages varied widely, from 138 EUR in Bulgaria to 1 801 EUR in Luxembourg. When adjusted for differences in purchasing power, the disparities between the Member States are reduced from a range of one to thirteen (in €) to a range of one to five in purchasing power standard (PPS)*. At the opposite ends of the scale were again Luxembourg (1,495 PPS per month) and Bulgaria (272 PPS).

Key: Belgium (BE) France (FR) Austria (AT) Bulgaria (BG) Italy (IT) Poland (PL) Czech Republic (CZ) Cyprus (CY) Portugal (PT) Denmark (DK) Latvia (LV) Romania (RO) Germany (DE) Lithuania (LT) Slovenia (SI) Estonia (EE) Luxembourg (LU) Slovakia (SK) Ireland (IE) Hungary (HU) Finland (FI) Greece (EL) Malta (MT) Sweden (SE) Spain (ES) Netherlands (NL) United Kingdom (UK) Iceland (IS) Norway (NO) Liechtenstein (LI) Switzerland (CH)
* Purchasing power standard: (PPS), is an artificial currency unit. Theoretically, one PPS can buy the same amount of goods and services in each country. However, price differences across borders mean that different amounts of national currency units are needed for the same goods and services depending on the country. PPS are derived by dividing any economic aggregate of a country in national currency by its respective purchashing power parities. PPS is the technical term used by Eurostat for the common currency in which national accounts aggregates are expressed when adjusted for price level differences using PPPs. Thus, PPPs can be interpreted as the exchange rate of the PPS against the euro euro.
Source: Eurostat
——————————————————————————————————————————————————
Minimum Wages and Austerity
Check out Minimum wages in Europe under austerity. Published by ETUI, the report analyses recent trends in minimum wages across Europe in the light of the economic crisis. In most European countries, workers earning the minimum wage suffered losses – in some cases quite considerable losses – in real pay. This reflects not least the fact that, in the context of austerity policies, minimum wage policy has been used to slow overall wage increases. This has served to exacerbate the demand-depressing effects of austerity policies and is one factor behind the economic stagnation that much of Europe is experiencing.
——————————————————————————————————————————————————
Average Wages
Among EU Member States, the mean (average) gross annual earnings of full-time employees in enterprises with ten or more employees were highest in Denmark (€56,044) in 2009, followed by Luxembourg (in 2010), Ireland, the Netherlands and Germany (in 2010) – all above €40,000 – while earnings were lowest in Romania (€5,891 in 2010) and Bulgaria (€4, 085)
In 2006, median annual earnings showed a broadly similar ranking of countries, with mean earnings higher than median earnings in all countries except Malta. The proportion of employees considered to be low wage earners in 2006 was highest in Latvia, at 30.9 %, while more than one in four employees were also considered as low wage earners in Lithuania, Bulgaria and Romania.
Private (business) sector
Average (mean), gross

Median, gross, Euros

*Median: the middle value in a group of numbers ranked in order of size. The median is that value of the variate which divides the total frequency into two halves. In other words, it is the number in a range of scores that falls exactly in the middle so that 50% of the scores are above and 50% are below.
More on…
Eurostat wages and labour costs statistics
Fat Cat pay in Germany
Proportion of EU workers on low wages rises
Higher wages key to eurozone revival, think tank says
Discussion
Trackbacks/Pingbacks
Pingback: More with millions, millions in misery | Revolting Europe - June 20, 2013